Test Anomaly Modules Using Matrix Profile
Both New York taxi data and steam generator data are used
Demonstrate a couple of functions of matrix profile:
normal: calculate matrix profile of each time series
approx: compute an approximate matrix profile
incremental: compute incremental matrix profile for streaming time series data
kdp: identify the best K out of N time series that have detected anomalies at the same time slot using k-dimensional profile
Anomaly types and matrix profile can convert different types fo anomalies into outliers
Set up paths and load matrix profile module
[1]:
import numpy as np
import pandas as pd
import os
import sys
import warnings
warnings.filterwarnings("ignore")
# set up DACKAR path
cwd = os.getcwd()
frameworkDir = os.path.abspath(os.path.join(cwd, os.pardir, 'src'))
sys.path.append(frameworkDir)
# set up data path
data_path = os.path.abspath(os.path.join(cwd, os.pardir, 'data'))
# Load MatrixProfile module for anomaly detection
from dackar.anomalies.MatrixProfile import MatrixProfile
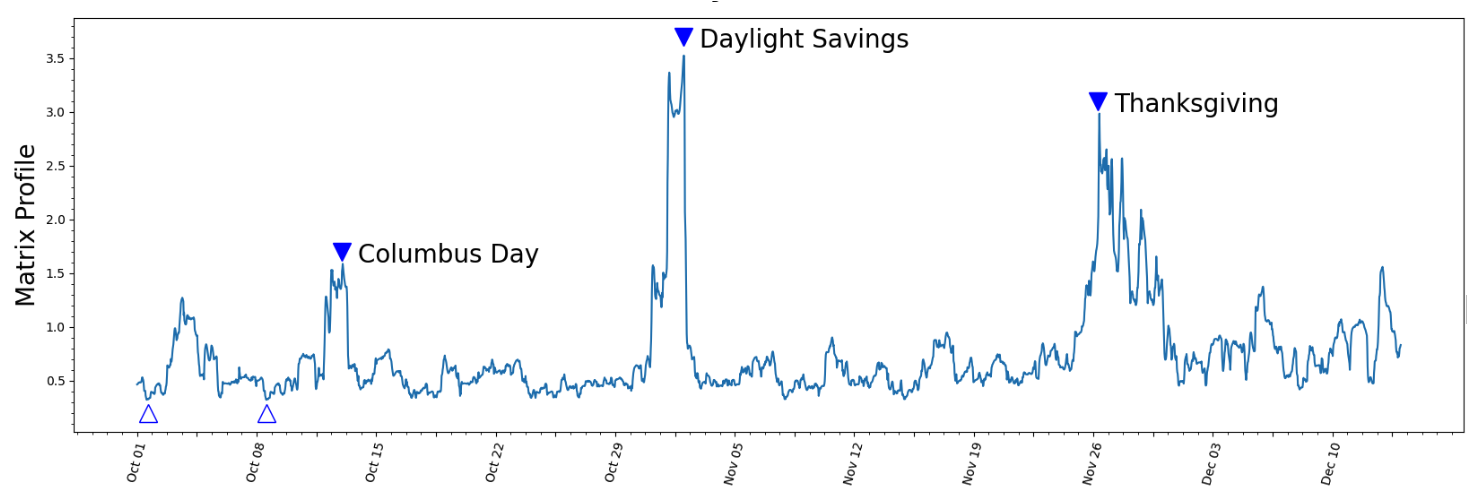
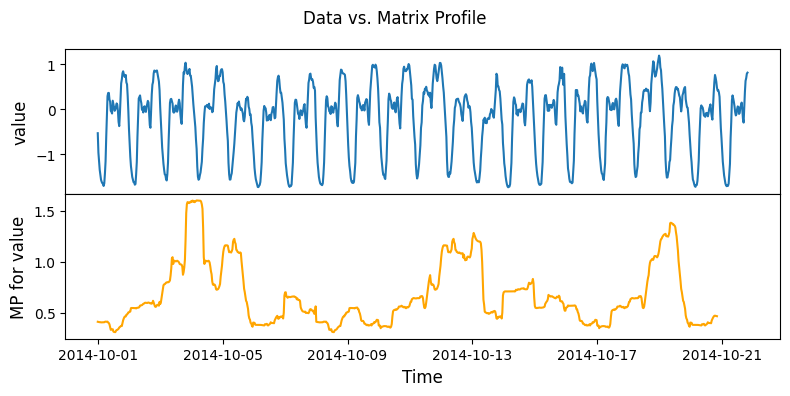
Calculate the matrix profiles for NY taxi data
Anomalies occur during Columbus day, Daylight savings and Thanksgiving
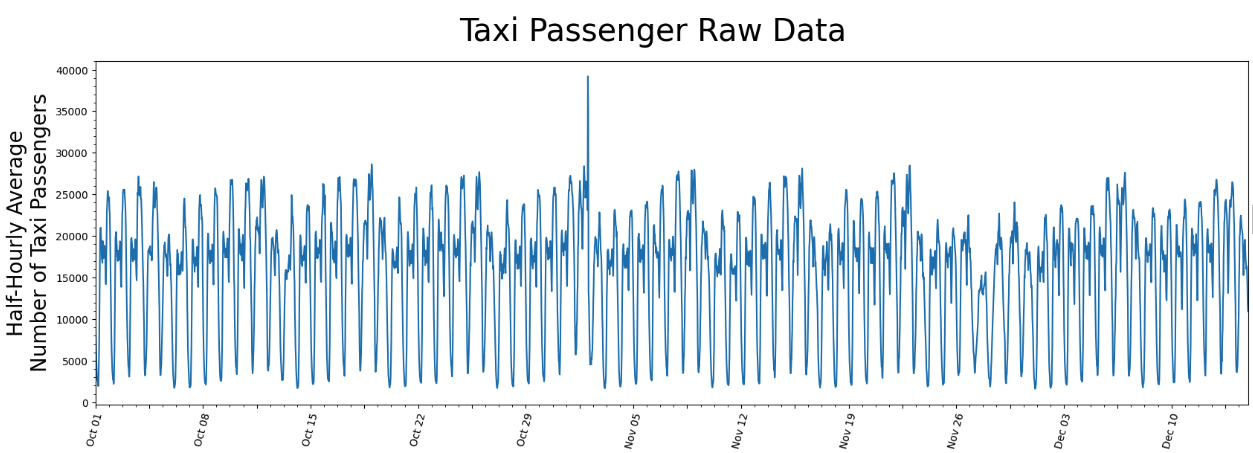
Link: https://stumpy.readthedocs.io/en/latest/Tutorial_STUMPY_Basics.html
Load NY taxi data
[2]:
# Load taxi data
taxi_data_file = os.path.abspath(os.path.join(data_path, 'nyc_taxi_passengers.csv'))
taxi_df = pd.read_csv(taxi_data_file, index_col='timestamp')
taxi_df['value'] = taxi_df['value'].astype(np.float64)
taxi_df.index = pd.to_datetime(taxi_df.index, errors='ignore')
taxi_df.head()
[2]:
| value | |
|---|---|
| timestamp | |
| 2014-10-01 00:00:00 | 12751.0 |
| 2014-10-01 00:30:00 | 8767.0 |
| 2014-10-01 01:00:00 | 7005.0 |
| 2014-10-01 01:30:00 | 5257.0 |
| 2014-10-01 02:00:00 | 4189.0 |
Compute the Matrix Profile for NY taxi data
[3]:
# set up sliding window side to 48 hours
m = 48
mpObj = MatrixProfile(m, normalize='robust', method='normal')
mpObj.fit(taxi_df)
fig = mpObj.plot()
OMP: Info #276: omp_set_nested routine deprecated, please use omp_set_max_active_levels instead.

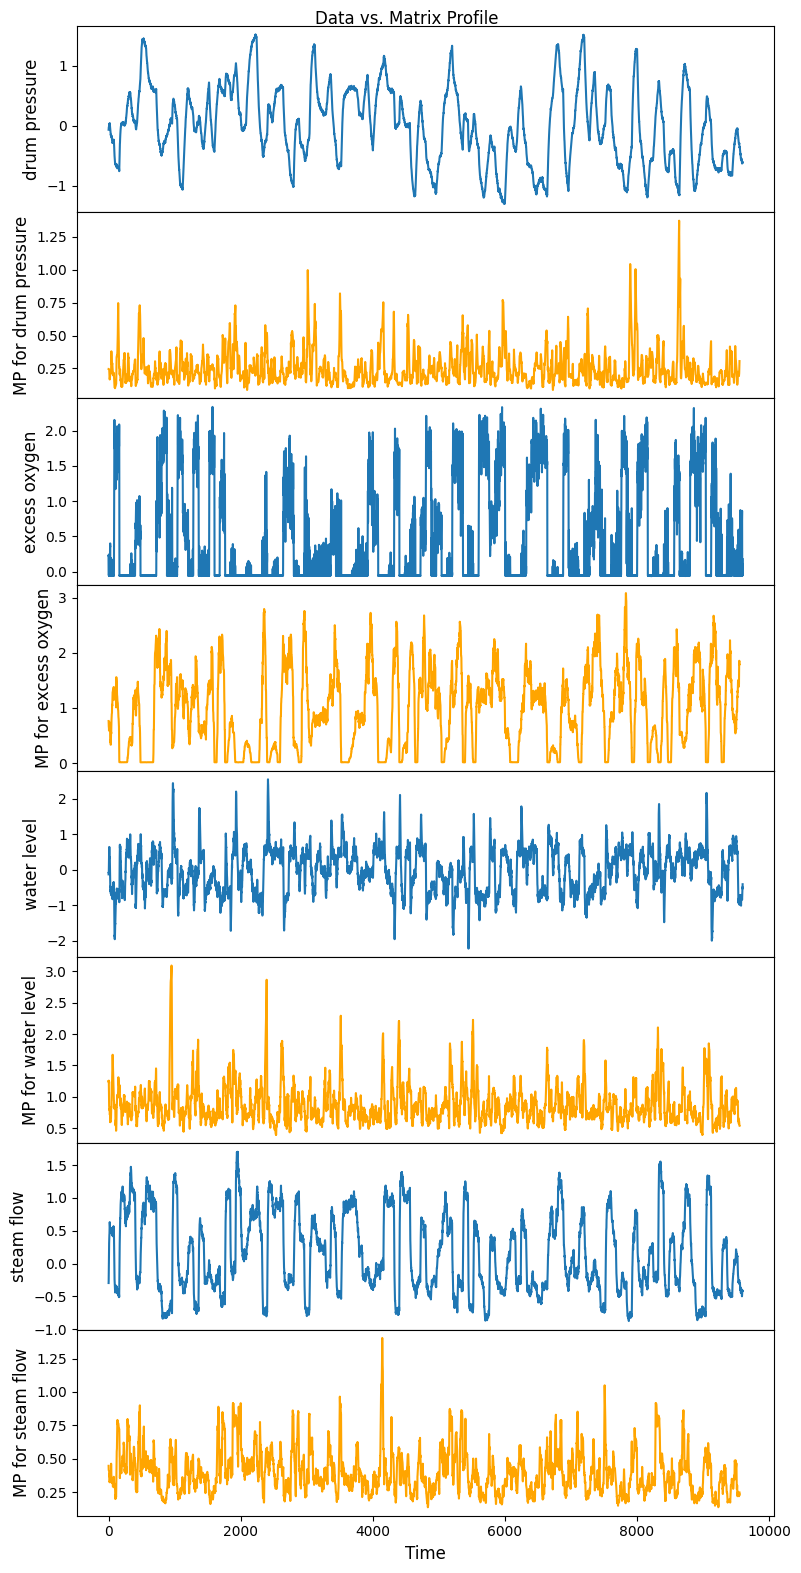
Calculate matrix profile for steam generator data
Load data
[4]:
steam_gen_data_file = os.path.abspath(os.path.join(data_path, 'Steamgen.csv'))
steam_df = pd.read_csv(steam_gen_data_file)
steam_df.head()
[4]:
| drum pressure | excess oxygen | water level | steam flow | |
|---|---|---|---|---|
| 0 | 320.08239 | 2.506774 | 0.032701 | 9.302970 |
| 1 | 321.71099 | 2.545908 | 0.284799 | 9.662621 |
| 2 | 320.91331 | 2.360562 | 0.203652 | 10.990955 |
| 3 | 325.00252 | 0.027054 | 0.326187 | 12.430107 |
| 4 | 326.65276 | 0.285649 | 0.753776 | 13.681666 |
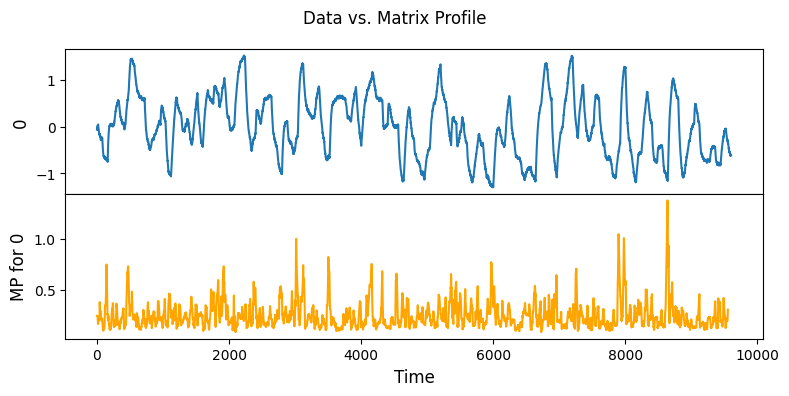
Compute matrix profile for steam generator data
[5]:
m = 48
mpObj = MatrixProfile(m, normalize='robust', method='normal')
mpObj.fit(steam_df)
fig = mpObj.plot()
Testing ‘approx’ method to compute matrix profile
[6]:
m = 48
mpObj = MatrixProfile(m, normalize='robust', method='approx')
mpObj.fit(steam_df)
fig = mpObj.plot()

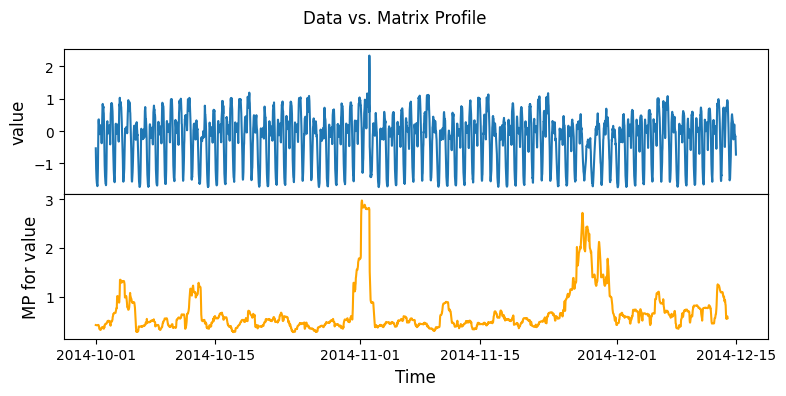
Enable Streaming, use ‘evaluate’ function for streaming data
Compute matrix profile for first 1000 data points
[7]:
m = 48
mpObj = MatrixProfile(m, normalize='robust', method='incremental')
mpObj.fit(taxi_df.iloc[0:1000])
fig = mpObj.plot()
Evaluate more data points to demonstrate data streaming
[8]:
mpObj.evaluate(taxi_df.iloc[1000:])
fig = mpObj.plot()
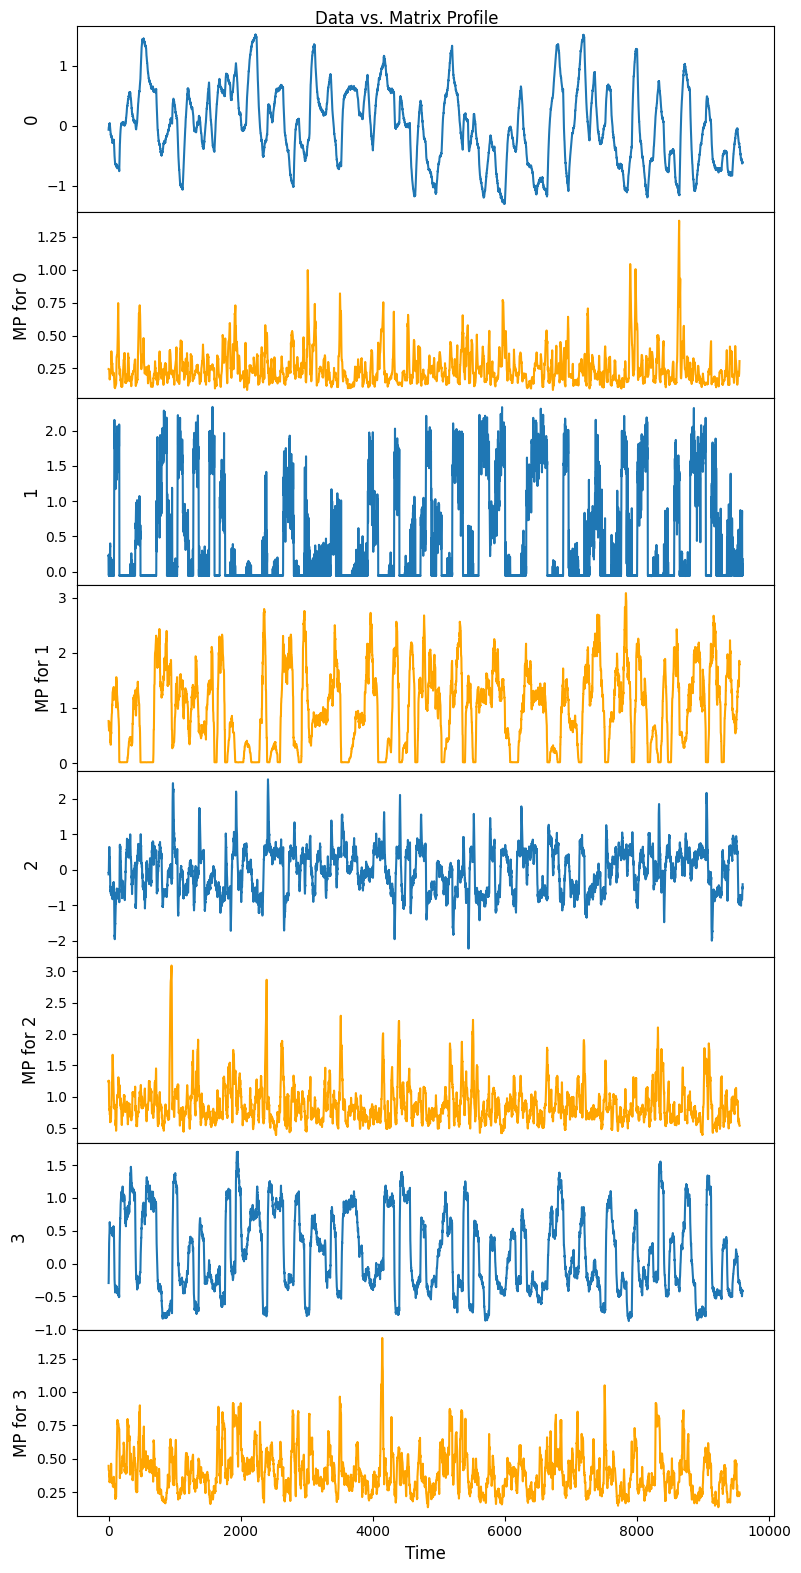
Test different data structure
Data structure: numpy.ndarray
[9]:
m = 48
mpObj = MatrixProfile(m, normalize='robust', method='normal')
mpObj.fit(steam_df.to_numpy())
fig = mpObj.plot()
Data structure: 1-D array data
[10]:
m = 48
mpObj = MatrixProfile(m, normalize='robust', method='normal')
mpObj.fit(steam_df.to_numpy()[:,0])
fig = mpObj.plot()
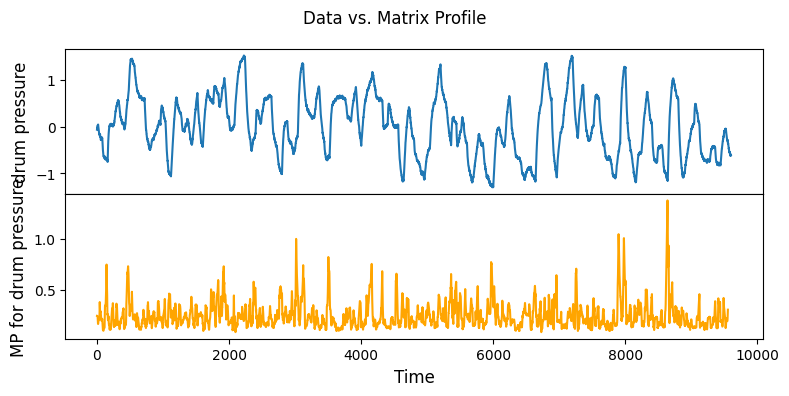
Data structure: pandas.Series data
[11]:
m = 48
mpObj = MatrixProfile(m, normalize='robust', method='normal')
mpObj.fit(steam_df['drum pressure'])
fig = mpObj.plot()
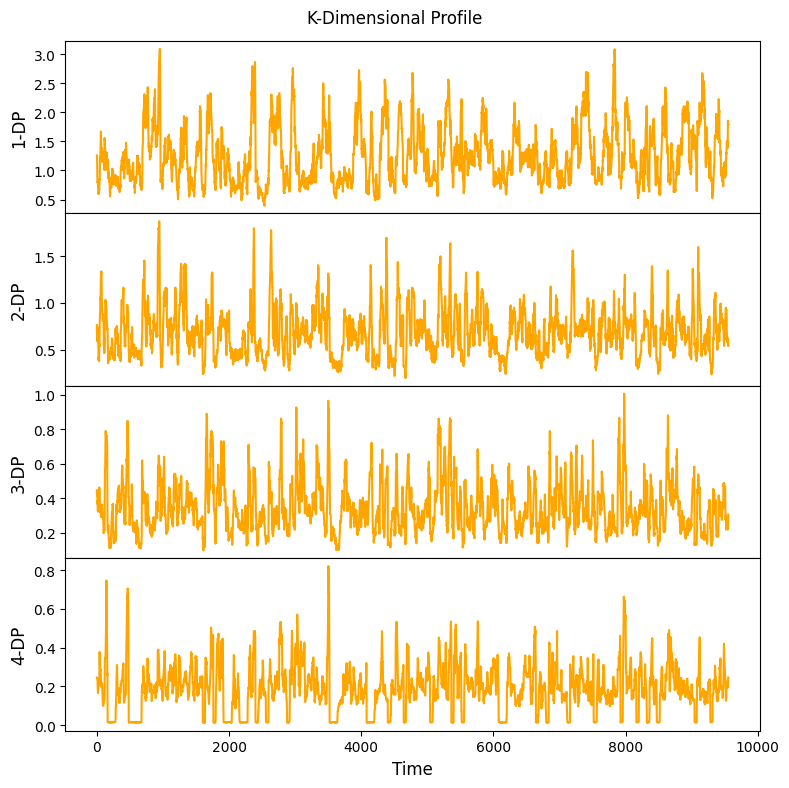
Test Multi-Dimensional Anomaly Detection: Identify Best K out of N Anomalies
[12]:
m = 48
mpObj = MatrixProfile(m, normalize='robust', method='normal', kdp=True)
mpObj.fit(steam_df)
fig = mpObj.plot_kdp()