LML Functionality Demo
Set up path and load modules
[1]:
import matplotlib.pyplot as plt
import networkx as nx
import os, sys

cwd = os.getcwd()
frameworkDir = os.path.abspath(os.path.join(cwd, os.pardir, 'src'))
sys.path.append(frameworkDir)

from dackar.utils.mbse.LMLparser import LMLobject
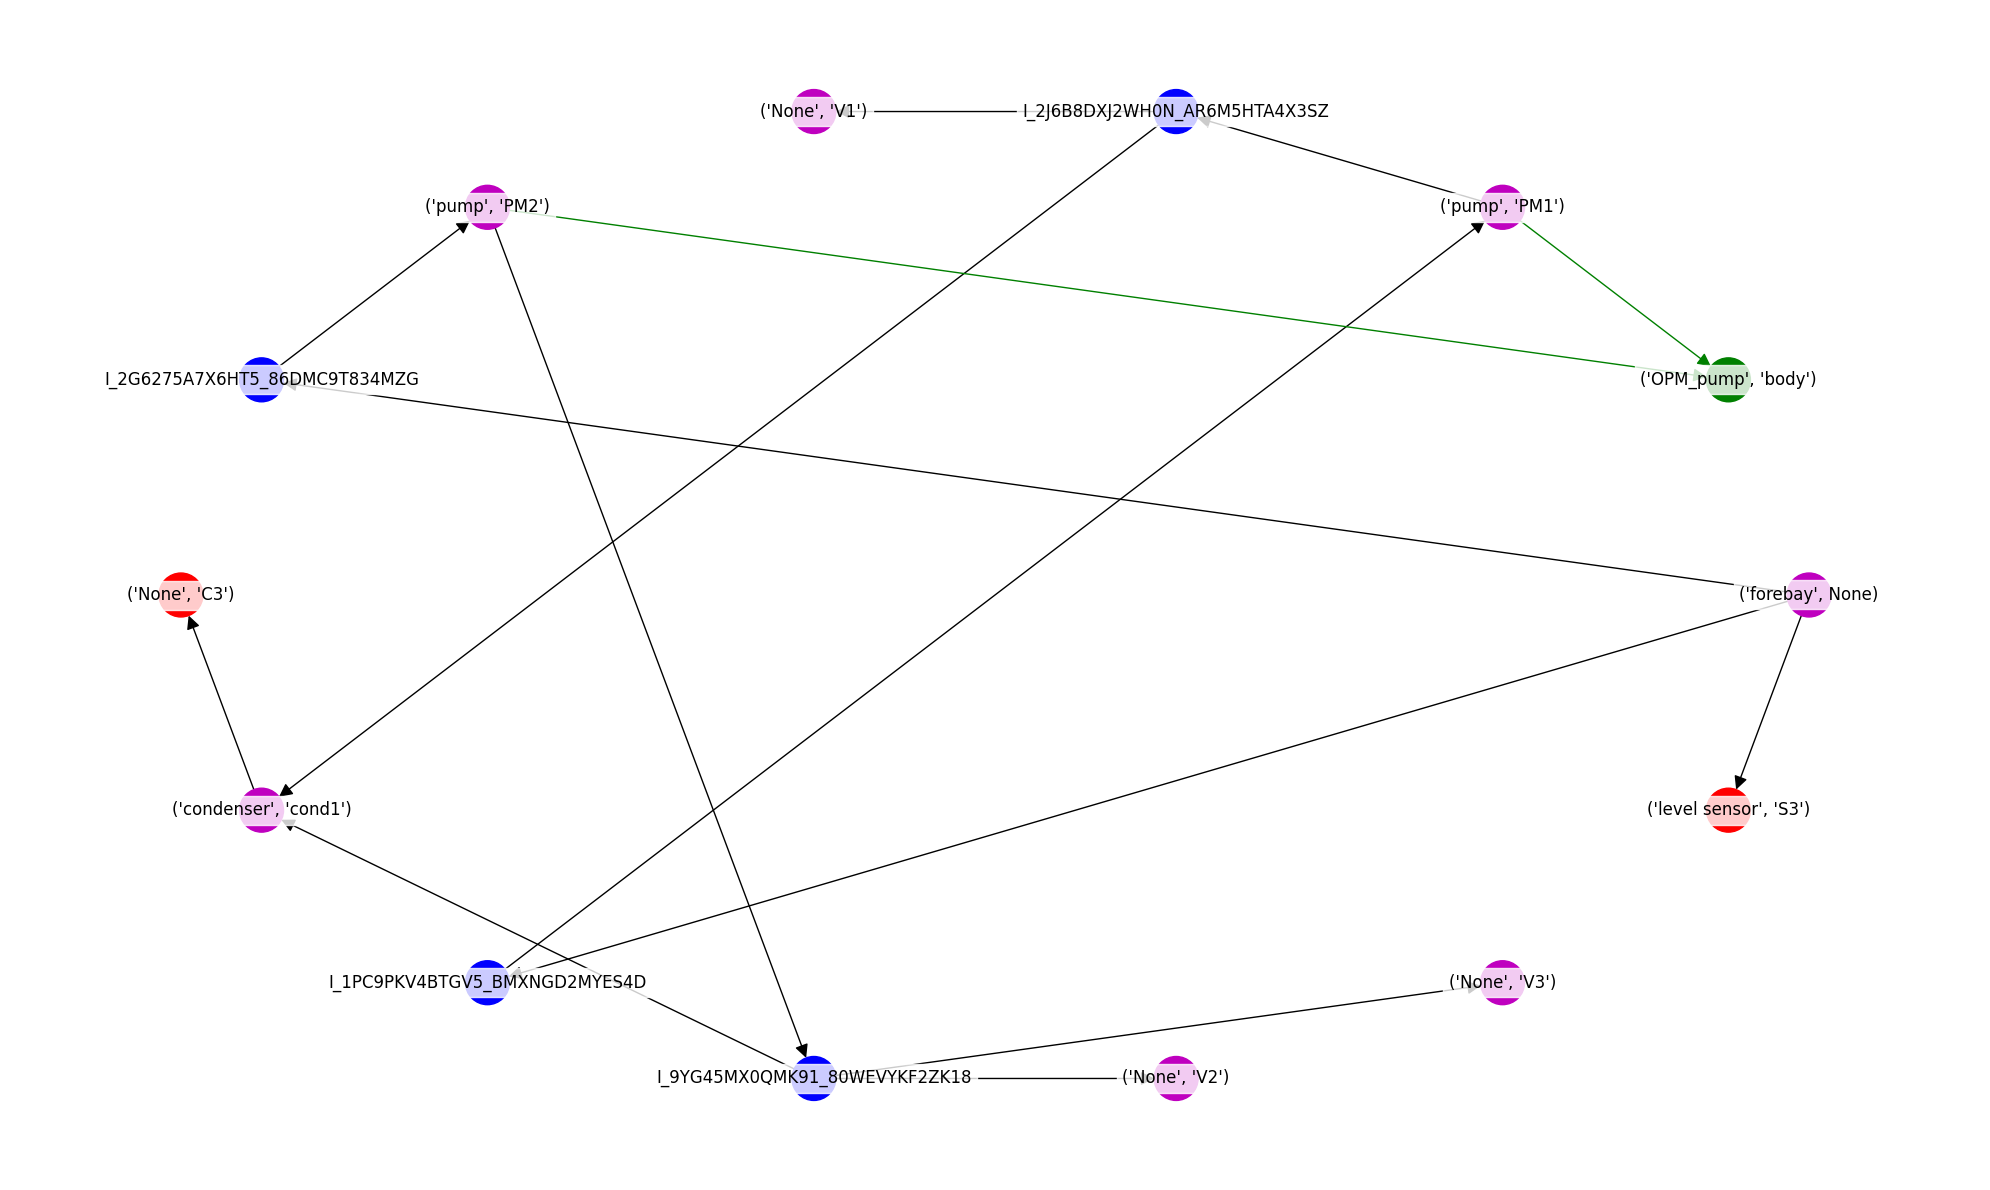
Load LML file and plot it through networkx
[2]:
test = LMLobject('../data/LML.xml')
test.LMLparser('test_analytical')
testGraph = test.returnGraph()

edge_colors = nx.get_edge_attributes(testGraph,'color').values()
node_colors = nx.get_node_attributes(testGraph,'color').values()

label_options = {"ec": "white", "fc": "white", "alpha": 0.8}
fig, ax = plt.subplots(figsize=(20, 12))
nx.draw_shell(testGraph, node_color=node_colors, edge_color=edge_colors, with_labels=True, bbox=label_options, arrowsize=20, node_size=1000)
plt.gca()
fig.tight_layout()
plt.axis("off")
plt.show()
Return entity list from LML object
[3]:
ent, sub = test.returnEntities()
ent
[3]:
{'I_1ANY76DXGGJHF_9DGRFMPMJ53R3': ('condenser', 'cond1'),
 'I_3VKFEY727MKCY_8Y457TV9VW3Y1': ('forebay', None),
 'I_2970C68C78KHH_BKEXT5HRKBFAC': ('pump', 'PM1'),
 'I_654C7PJE4CGFQ_A4R58Z120VYQH': ('pump', 'PM2')}
Return list of IDs
[4]:
test.returnListIDs()
[4]:
['PM1',
 'PM2',
 ('None', 'V2'),
 ('None', 'C3'),
 'cond1',
 ('None', 'V3'),
 ('None', 'V1'),
 ('level sensor', 'S3')]
Dump nodes and edges files into csv
[5]:
test.dumpNodesEdgesFiles('test')